Context
The central idea behind this project was simple but highly practical: give people real visibility into power and energy consumption instead of leaving them to discover usage only when a bill arrives. The system was designed to measure electrical energy in real time and publish the current consumption to a web server, allowing both the end user and the utility provider to see live readings. That makes it useful for homes, rooms, or even individual appliances such as air conditioners, irons, or electric heaters.
In a setting where energy misuse, inaccurate billing, and load-shedding pressures are common concerns, a smart meter becomes more than a measurement device — it becomes a tool for accountability. By making energy consumption visible and easy to interpret, the system encourages more conscious usage and supports fairer billing correction workflows.
02Accurate, cheap, and live — pick all three
The challenge was to build a compact, low-cost, and reliable energy monitoring platform that could measure voltage and current accurately and convert those signals into usable power and energy values. That required careful attention to signal conditioning, safe AC interfacing, calibration, and the decision of how to communicate the results without adding unnecessary complexity.
On the implementation side, the project also needed to balance affordability with industrial-grade measurement quality. The design had to be easy to fabricate, robust enough for real loads, and practical enough to display both local readings and remote values through a web-connected interface. The final solution needed to work not just in simulation, but in a hardware system that could actually read energy use from a live single-phase supply.
03What was built
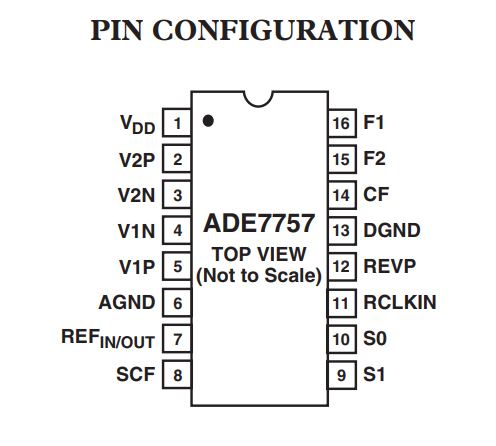
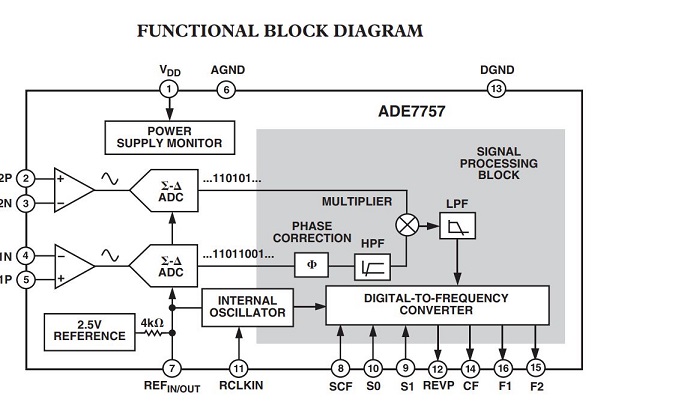
The project began with the ADE7757 energy metering IC, chosen because it is designed for high-accuracy single-phase energy measurement and includes a built-in oscillator, on-chip power monitoring, and digital outputs that make it suitable for embedded metering applications. The ADE7757 provides average real power on the low-frequency outputs F1 and F2 and a high-frequency CF output intended for calibration and instantaneous power measurement.
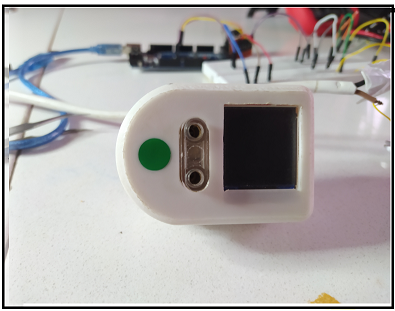
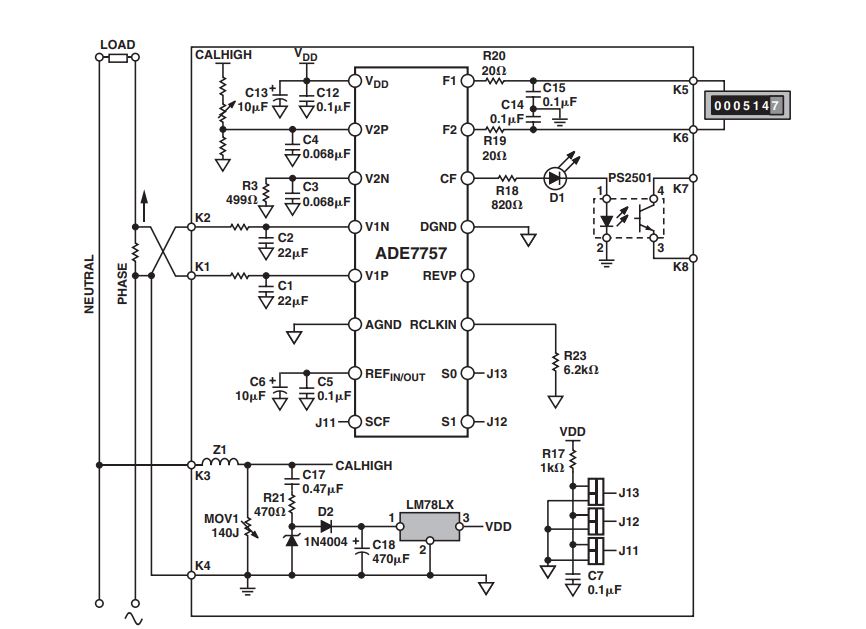
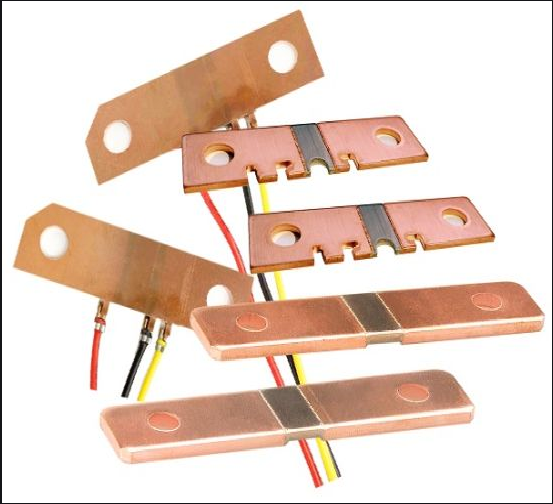
The design then advanced into a complete embedded system: PCB design in EAGLE, component placement, milling, soldering, calibration, firmware integration, and 3D enclosure fabrication. The project included a voltage channel, a current channel, a shunt resistor-based sensing path, and a connection to an ESP8266 module for wireless communication. The meter also included an LCD display so local readings were visible without needing a connected device, and the web interface made remote observation possible if the device was connected to WiFi.
Programming involved reading the pulse output from the energy meter IC and converting pulse frequency into power and energy values. This was done with interrupt-based counting on the microcontroller, with the pulse width changing as the load changed. The idea was to correlate the pulse output with load level: when the load was low, pulse width was longer; as the load increased, pulse frequency also changed in a predictable way, enabling power and energy to be computed from the pulse stream.
04System thinking
Measurement front end
The ADE7757 formed the core metering stage. The voltage and current channels were designed to sense the live AC signal and shunt voltage drop, while the IC processed them into calibrated power-related output pulses. This output made the low-level signal conversion practical for an MCU to interpret.
Microcontroller and interfaces
The ESP8266 used the meter output as an interrupt-driven signal source. It processed the pulse counts, calculated power and total energy, and exposed the results on a local display and web server. The digital interface was therefore doing both measurement and communication tasks.
PCB and fabrication
The board was designed and milled in-house using CAD and digital fabrication workflows. The project demonstrated the full chain: schematic development, PCB routing, trace milling, drilling, soldering, and final assembly of the breakout board and enclosure.
Web and user interaction
Once the hardware was functional, a simple web page was added so the measured power and energy values could be displayed over WiFi. This made the device practical not just as a standalone meter, but as a connected monitoring platform for users and suppliers.
Results and lessons
The final device was successfully tested with real loads, including 100W and 200W bulbs, and the pulse behavior changed as predicted with load variation. This validated the core measurement approach and the interrupt-based firmware model. The meter produced output pulses related to the instantaneous real power, which were then converted into power and energy values that could be displayed on the LCD and the web page.
More broadly, the project demonstrated a valuable engineering lesson: a smart system is not only about connectivity, but about making a meaningful physical quantity visible and actionable. By showing live consumption data, the system supports better decision-making, reduces misuse of electricity, and improves fairness in utility interaction. It also reinforced the practical value of combining digital fabrication, embedded systems, and software into a single product workflow.